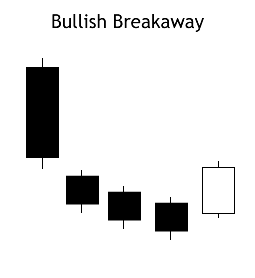
Bullish Breakaway Pattern
BULLISH BREAKAWAY PATTERN (BBP)
downtrend is decelerating, then a burst!
Characteristics:
1. Market is on a downtrend;
2. Day 1 has a long black stick;
3. On Day 2, we see a black stick with a gap below Day 1;
4. The lower consecutive closes show that the bearish mood continues on Day 3 and Day 4; and
5. On Day 5, we see a long white stick characterized by a closing price inside the gap caused by Day 1 and Day 2.
Brief Explanation:
The BBP appears during a downtrend and it shows that selling accelerated to the point of market that is oversold. It starts with a long black day then there is a gap in the direction of the downtrend. This is then followed by 3 consecutively lower price days. All the days in this pattern are black except Day 3 (either black or white). After the gap, the 3 days are similar to the Three Black Crows Pattern since the highs and lows are consecutively lower. The acceleration of the downtrend is now slowly deteriorating. Then we see a burst upward (opposite direction). This burst completely recovers the price action of the prior 3 days. The gap is not filled so the reversal is weak and short-term.
Notes:
1. A confirmation on Day 6 is suggested to ensure the reversal (through a white stick, a large gap up or a higher close).
